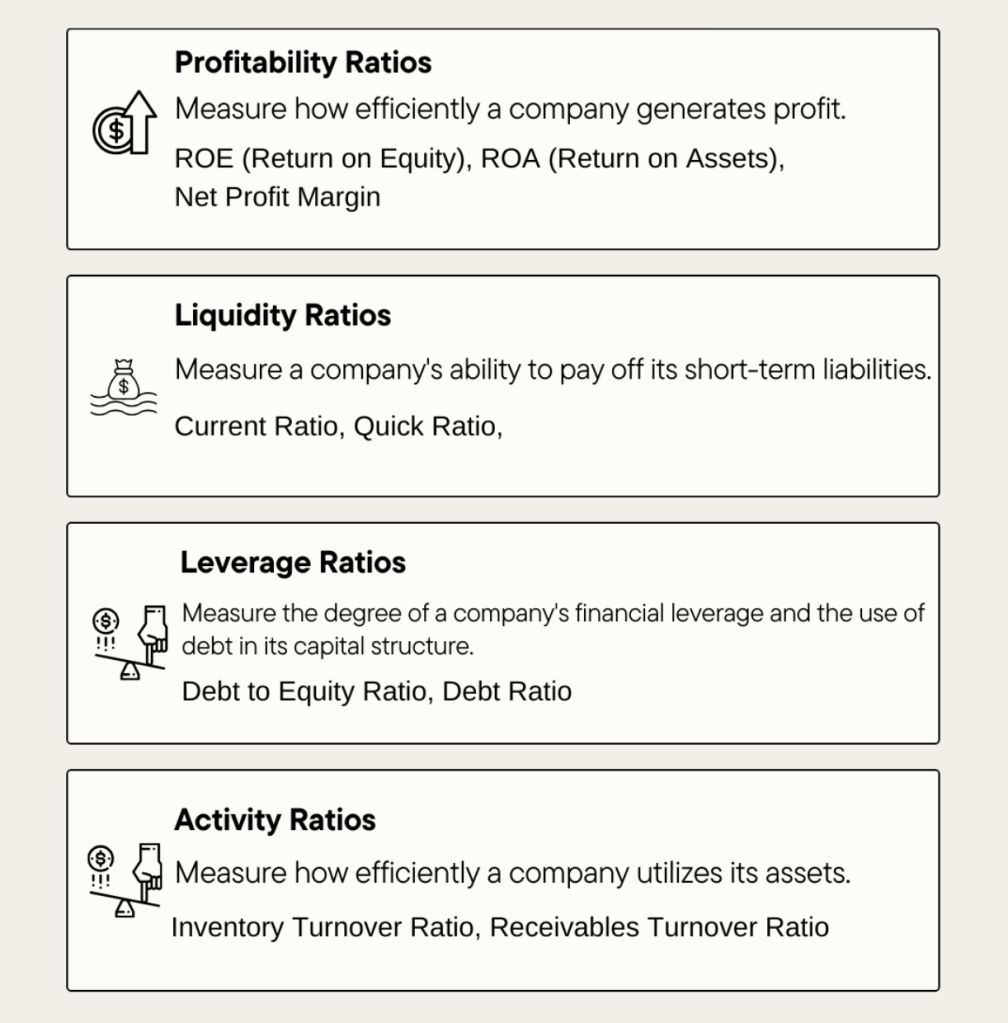
In this blog, we’ll explore four key types of financial ratios that every investor should have in their toolkit: profitability, liquidity, leverage, and activity ratios. By breaking these down, you’ll gain a clearer picture of how to evaluate companies, compare them within industries, and, ultimately, make smarter investment choices. Let’s dive in!
Overview of Financial Ratios
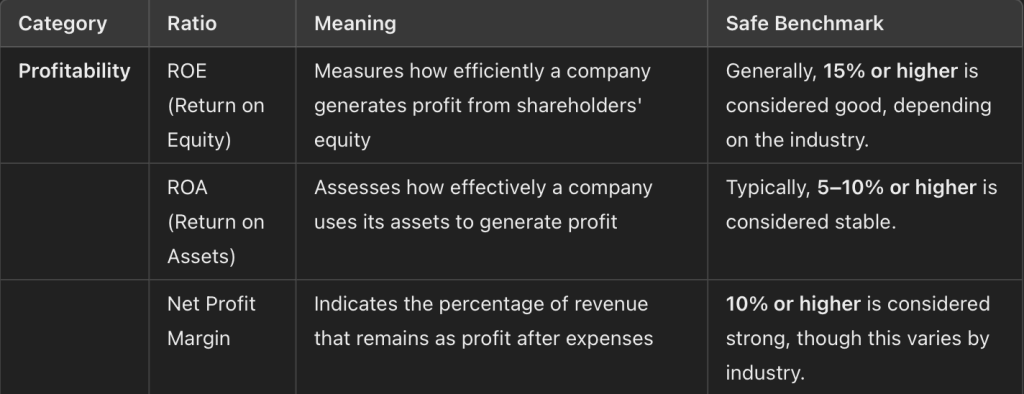
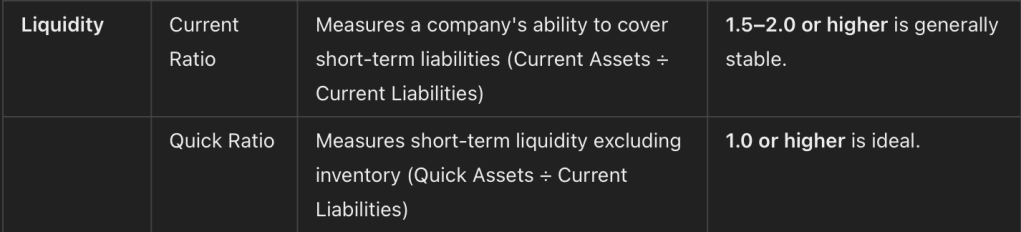
Key Ratios and Safe Benchmarks


In this guide, we’ll walk you through a 5-step process for using financial ratios to assess a company’s performance. Whether you’re a seasoned investor or just starting, these steps will help you interpret the data, identify strengths and weaknesses, and make better investment decisions. Let’s dive in and uncover what the numbers truly reveal!
5-Step Instruction for Using Financial Ratios in Analysis
- Gather Relevant Financial Data:
- Obtain the company’s financial statements (Income Statement, Balance Sheet, and Cash Flow Statement).
- Ensure the data is up-to-date and accurate, ideally spanning multiple years for trend analysis.
- Calculate Key Ratios:
- Compute the ratios from each category (Profitability, Liquidity, Leverage, Activity) using the appropriate formulas.
- For example:
- ROE = Net Income ÷ Shareholders’ Equity
- Current Ratio = Current Assets ÷ Current Liabilities
- Refer to the table for specific formulas.
- Compare Ratios to Benchmarks:
- Use the safe benchmarks provided or industry averages as a reference point.
- Analyze whether the company’s ratios indicate stability or risk.
- Example: A Debt-to-Equity Ratio above 1.0 might signal excessive reliance on debt.
- Analyze Trends Over Time:
- Review the company’s ratios over multiple periods to identify improvements or deteriorations.
- Example: A declining Current Ratio over three years could indicate worsening liquidity.
- Combine Ratios with Qualitative Insights:
- Contextualize the numbers by considering industry conditions, economic factors, and the company’s strategy.
- Example: A high Inventory Turnover Ratio might be excellent for a retailer but could indicate supply issues for a manufacturing firm.
- Look for red flags, such as high profitability ratios paired with poor liquidity or excessive leverage.
By following these steps, you can systematically evaluate a company’s financial health and make more informed investment decisions.

Leave a comment