Financial statements are key to smart investing. This post simplifies the three essentials—income statement, balance sheet, and cash flow statement—and shows how to use them to assess a company’s performance and potential.
Why Should You Look at Financial Statements?
Before investing, reviewing a company’s financial statements is essential. These information provide critical insights into the company’s financial health and help you make informed decisions.
Income Statement
This shows how much money the company earns (revenue) and how much it spends (expenses). It helps you evaluate the company’s profitability and ability to grow.
Balance Sheet
This outlines what the company owns (assets) and what it owes (liabilities). It allows you to assess the company’s financial stability and risk level.
Cash Flow Statement
This details the actual flow of cash in and out of the company. It is important for understanding the company’s liquidity and whether it has enough cash to operate and invest in future growth.
Financial Statement studying
Now, let me guide you through the key concepts and important checkpoints to focus on, in order, for the Income Statement, Balance Sheet, and Cash Flow Statement before making an investment decision.
(Income Statement)
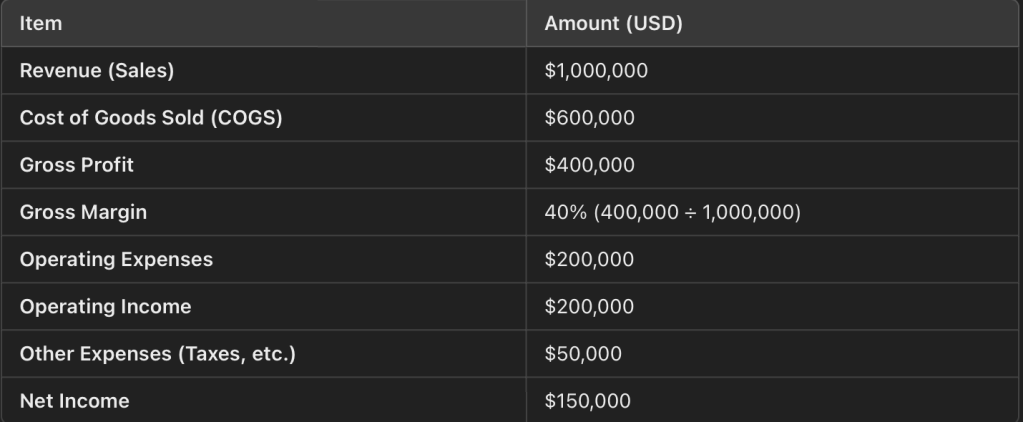
The table above is created for illustrative purposes. If you want to view actual financial statements for free, you can visit the following link: Yahoo Finance.
Why These Metrics Matter ? (Click me)
Revenue: Indicates the company’s ability to grow and capture market demand. Consistent growth shows strong performance.
Net Income: Measures profitability and cost management. Positive and stable net income signals financial health.
Gross Margin: Reflects pricing power and cost efficiency. A higher margin ensures sustainable profitability.
Key Checkpoints (Click me)
Consistent Revenue Growth: Verify if the company’s revenue is steadily increasing, indicating growth.
Stability of Net Income: Ensure the company maintains positive net income consistently and check for volatility.
Cost Structure: Analyze whether the costs are excessively high relative to revenue, which could indicate inefficiencies in management.
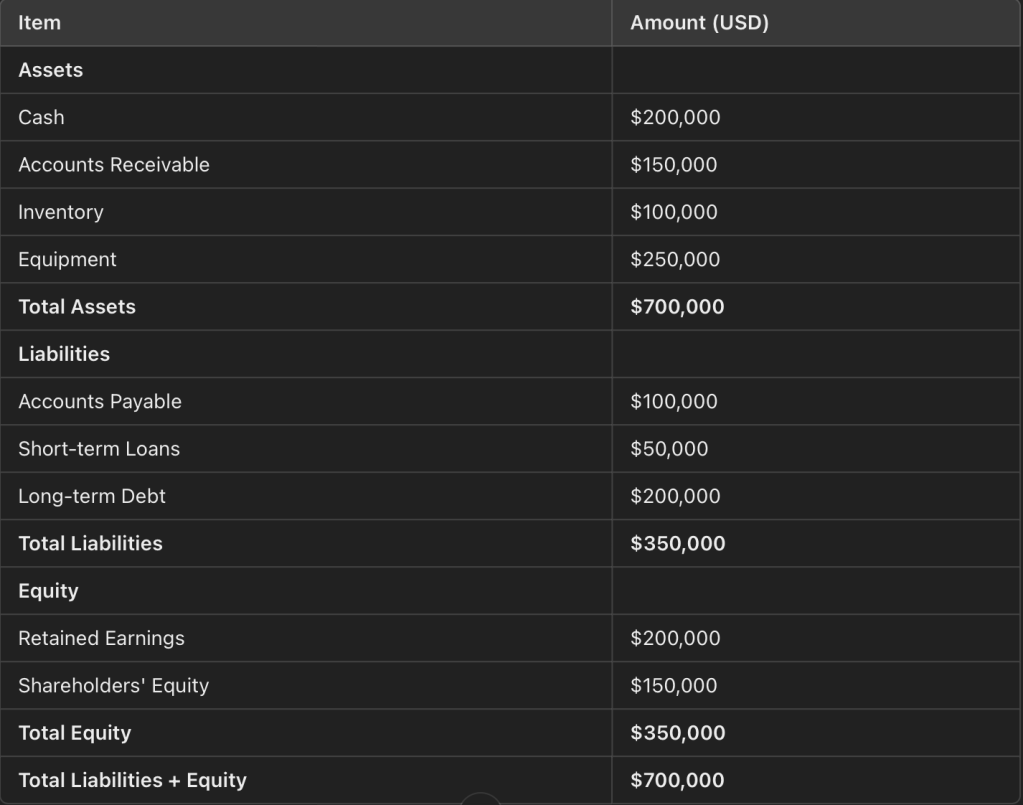
(Balance Sheet)
Why These Metrics Matter ? (Click me)
Assets: Represents everything the company owns, such as cash, property, and inventory.
Liabilities: Reflects the company’s debts or obligations that it needs to pay.
Equity: The net value of the company, calculated as Assets – Liabilities.
Equity shows the ownership value after settling all debts.
Key Checkpoints (Click me)
Debt-to-Asset Ratio: This ratio shows how much of the company’s assets are funded by debt, calculated as (Liabilities ÷ Assets) × 100. A ratio below 50% is generally considered stable.
Cash Reserves: Ensure the company has enough cash or cash equivalents to cover short-term debts.
Current Ratio: Measures whether the company can pay its short-term liabilities with its short-term assets, calculated as (Current Assets ÷ Current Liabilities). A ratio above 1 indicates good liquidity.
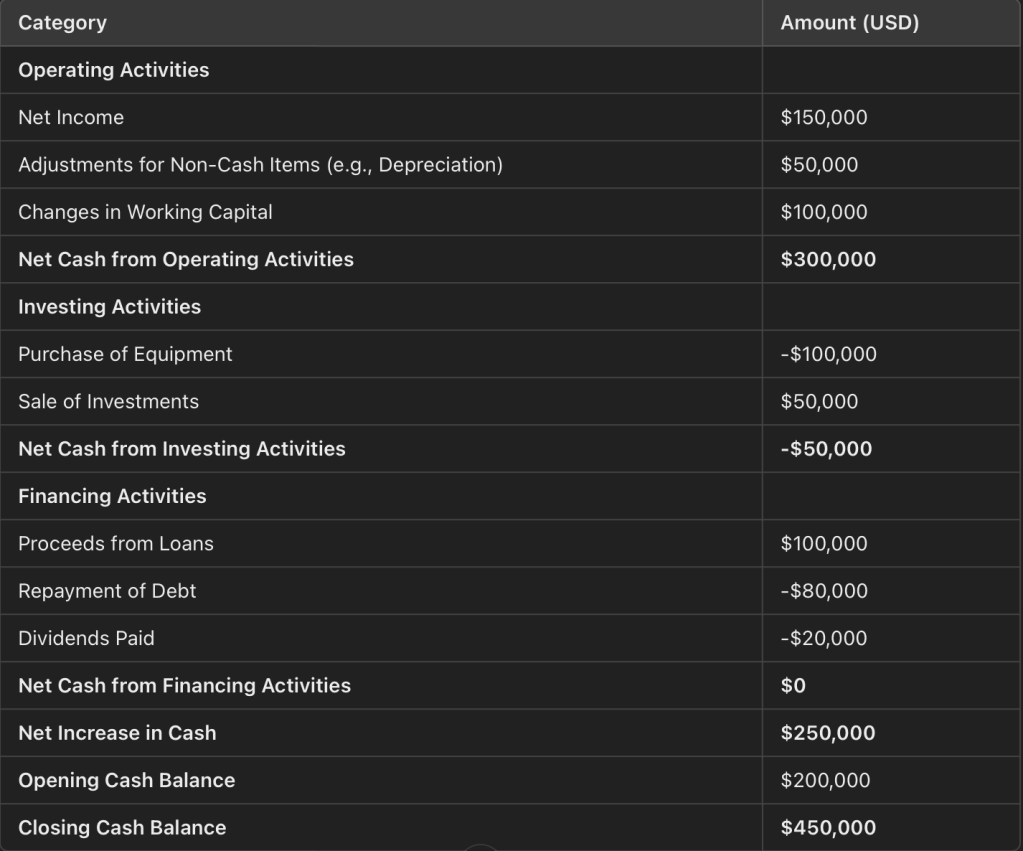
(Cash Flow Statement)
Why These Metrics Matter ? (Click me)
Operating Activities: Shows the cash generated by the company’s core operations. A positive figure means the company’s main business is bringing in cash.
Investing Activities: Tracks cash spent on or earned from investments, like buying equipment or selling investments.
Financing Activities: Reflects cash flows from borrowing, repaying debt, or paying dividends.
Key Checkpoints (Click me)
Operating Activities
What’s Good:
- Positive and consistent cash flow, showing the company’s core business is profitable.
- Growth in cash flow over time, indicating operational efficiency and business expansion.
What’s Bad:
- Negative cash flow, meaning the company is spending more than it earns from operations.
- Significant fluctuations, which could signal unstable revenue or poor cost management.
Investing Activities
What’s Good:
- Cash outflow due to investments in productive assets (e.g., equipment, property), signaling future growth.
- Cash inflow from selling non-essential or underperforming assets, which can improve liquidity.
What’s Bad:
- Excessive cash outflow without corresponding growth or returns, which might strain the company’s resources.
- Frequent asset sales, potentially indicating liquidity problems or short-term financial stress.
Financing Activities
What’s Good:
- Borrowing for expansion or strategic investments with a clear repayment plan.
- Dividend payments, which reflect the company’s ability to return value to shareholders.
What’s Bad:
Frequent or excessive dividend payments at the expense of reinvesting in the business.
Heavy reliance on debt to fund operations, which increases financial risk.
Quick to Remember
- Income Statement: Shows how much the company is earning (Revenue/Net Income).
- Balance Sheet: Reflects the company’s assets and liabilities ratio (Assets/Liabilities).
- Cash Flow Statement: Tracks the actual inflow and outflow of money (Cash Flow).
Practical Tips
- PER (Price-to-Earnings Ratio): Evaluates whether a stock is overvalued or undervalued compared to its earnings.
- ROE (Return on Equity): Measures profitability relative to equity, calculated as (Net Income ÷ Equity) × 100.
- Debt-to-Equity Ratio: Assesses whether the company’s debt is excessive compared to its equity, calculated as (Liabilities ÷ Equity).

Leave a comment